SynQ’s accuracy is over 75% accurate, on average, for all of the projections we’ve published. To back this claim up, we figured we needed to be more transparent in supplying data for our projections. After extensive feedback from our users, we have decided to be even more transparent with how we report our accuracies and historical data.
We’d like to present to you our newest creations: Projection History and Accuracy Status. These data feeds will be featured on each coin’s “Coin Detail Page” right after the Social Influence data feed.

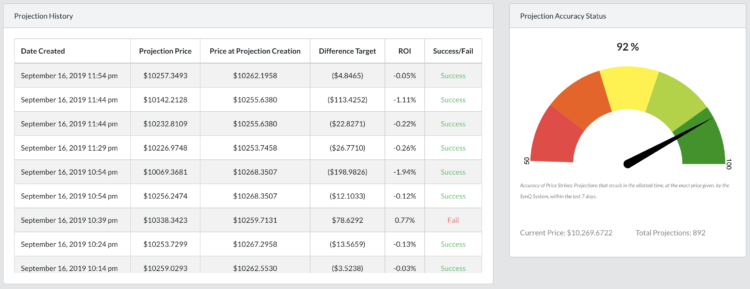
(BTC Projection History and Accuracy Status)
Projection History
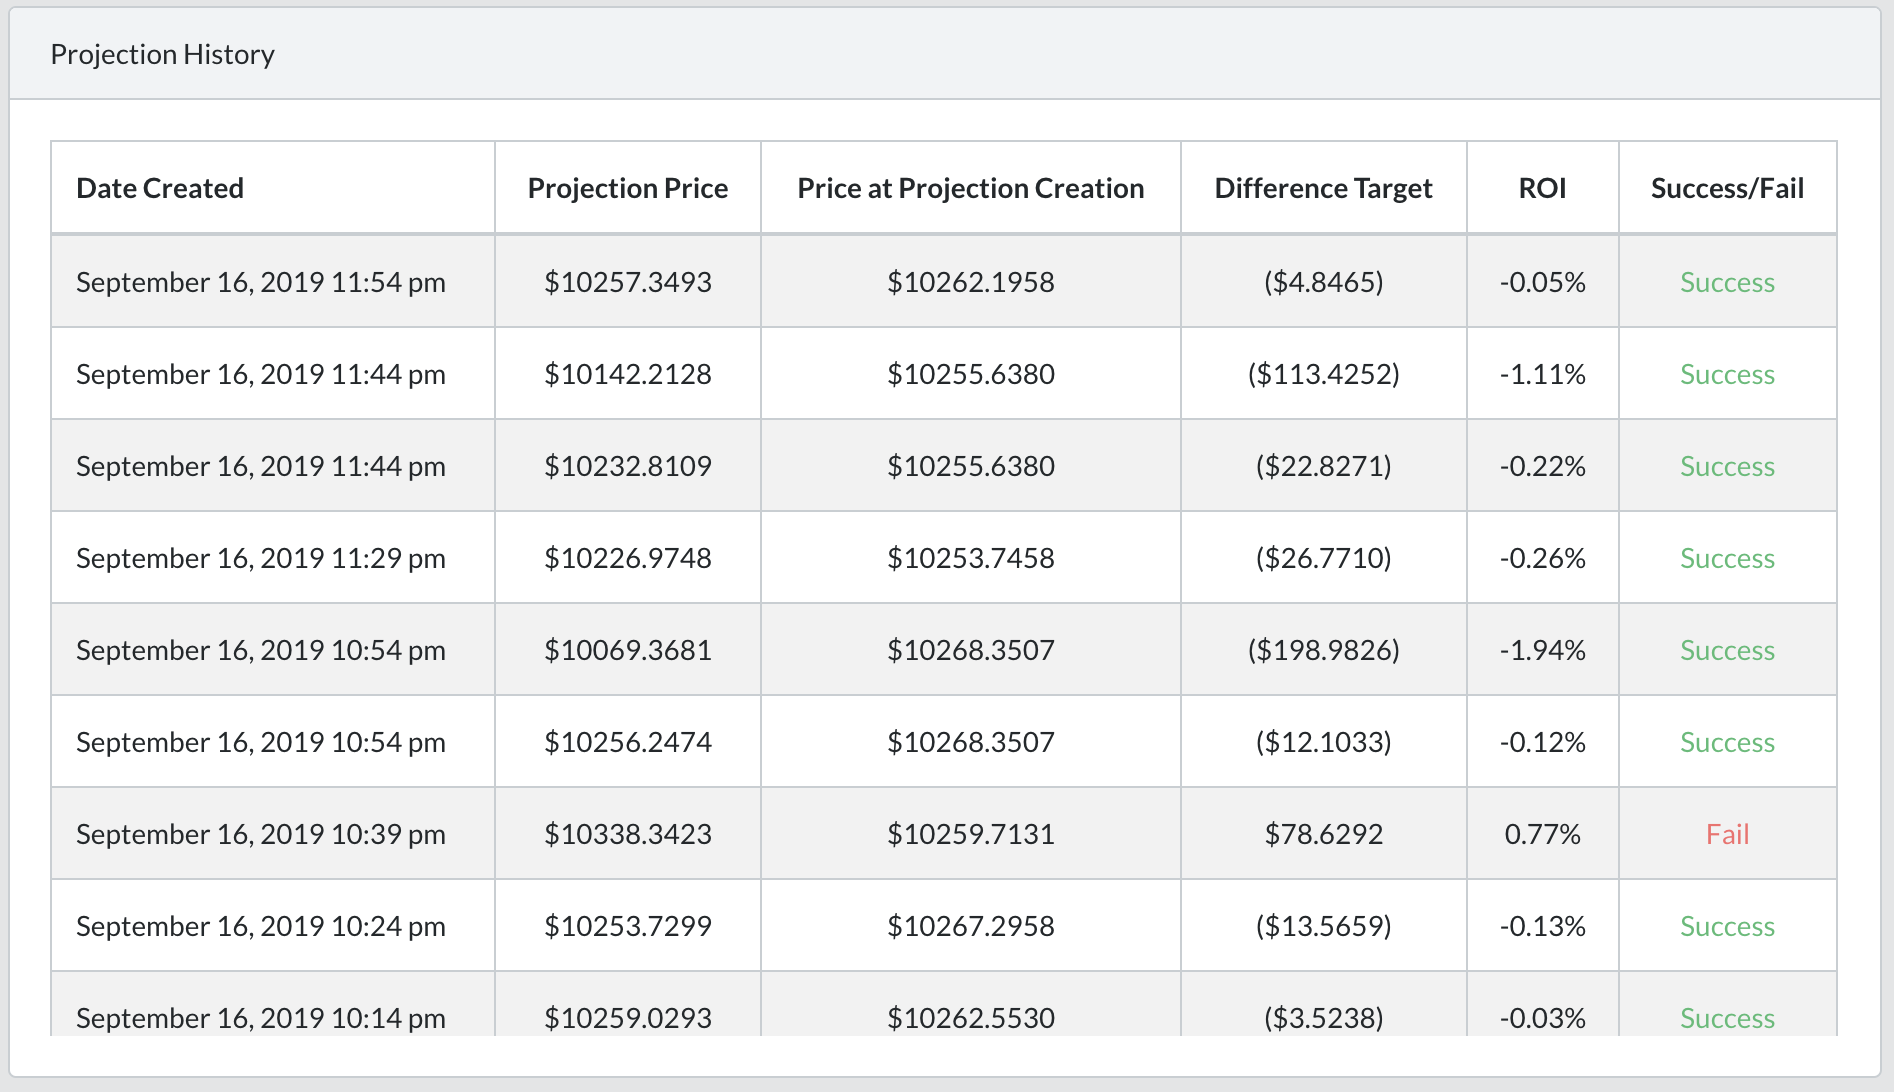
(BTC Projection History – Sept 17, 2019)
This chart displays all of a coin’s published projections going back for a full 7 days, and will be updated each day at 12am UTC-0. The goal of this is to increase transparency into published projections so that users can feel more comfortable using SynQ and back track a coin’s accuracy over a 7 day period
Accuracy Status
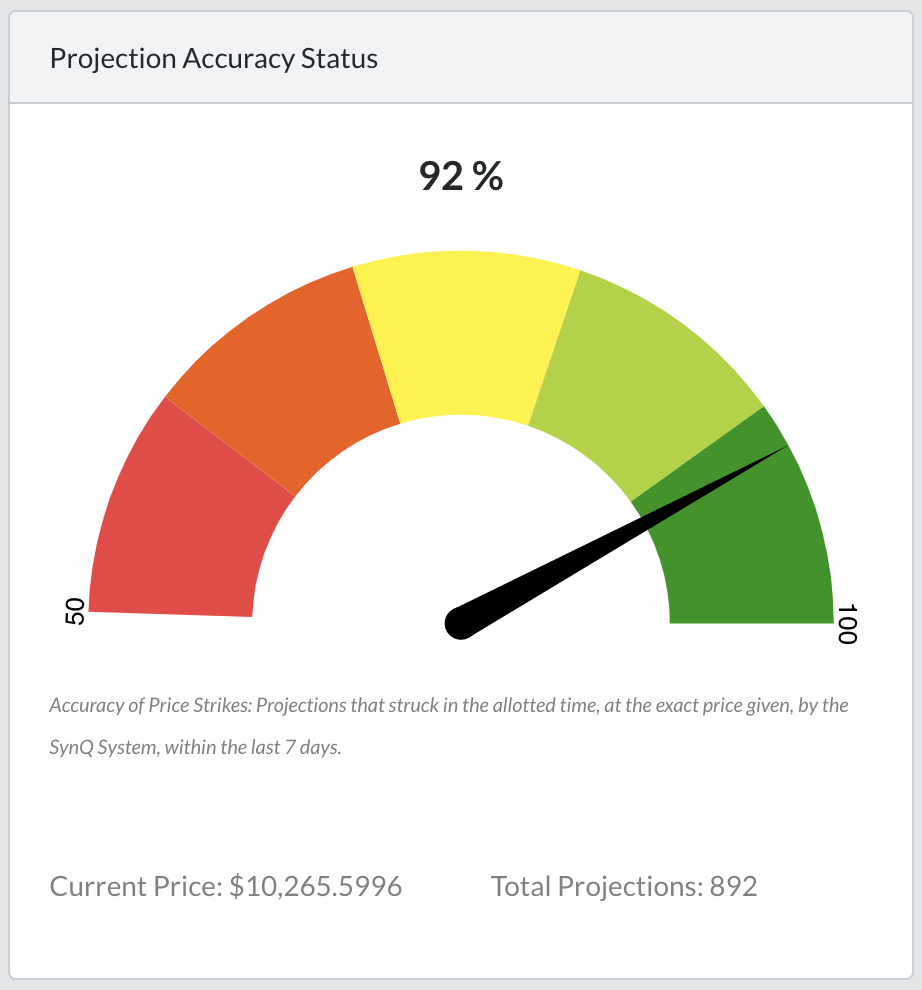
(BTC Accuracy Status – Sept 17, 2019)
This gauge shows the average 7 day accuracy of a specific coin. This gauge is a summary of all of the projections featured in Projection History and updates every day at 12am UTC-O.
Goals and Next Steps
As always, our goal is to provide better transparency for our consumers and the market. We want users to feel comfortable with and trust SynQ. This the first step in that process.
Soon, we will be featuring weekly data dumps and overall accuracy across SynQ on our homepage at synq.tech. Featuring this much data will allow everyone to see just how powerful SynQ is week over week.
Keep a lookout on our blog and our website for more updates!